The Logistic Distribution is a continuous single-parameter distribution which has been used extensively to represent growth functions. The Logistic Distribution curve has a shape similar to the Normal Distribution.
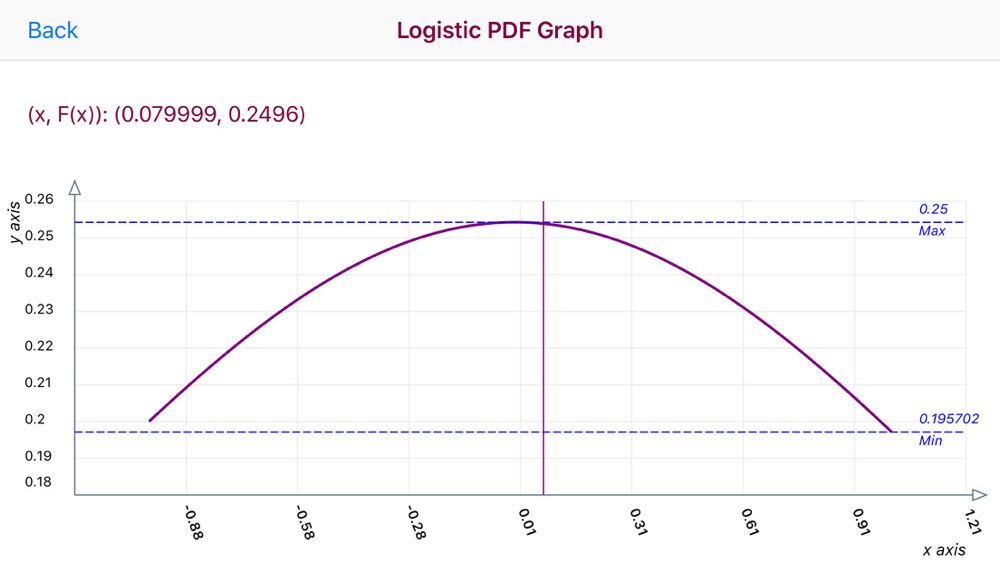
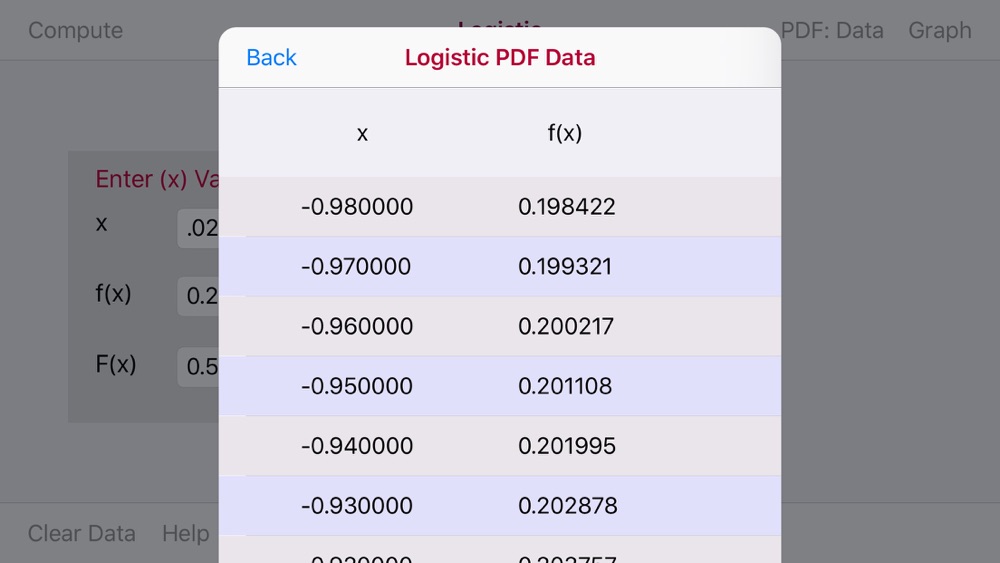
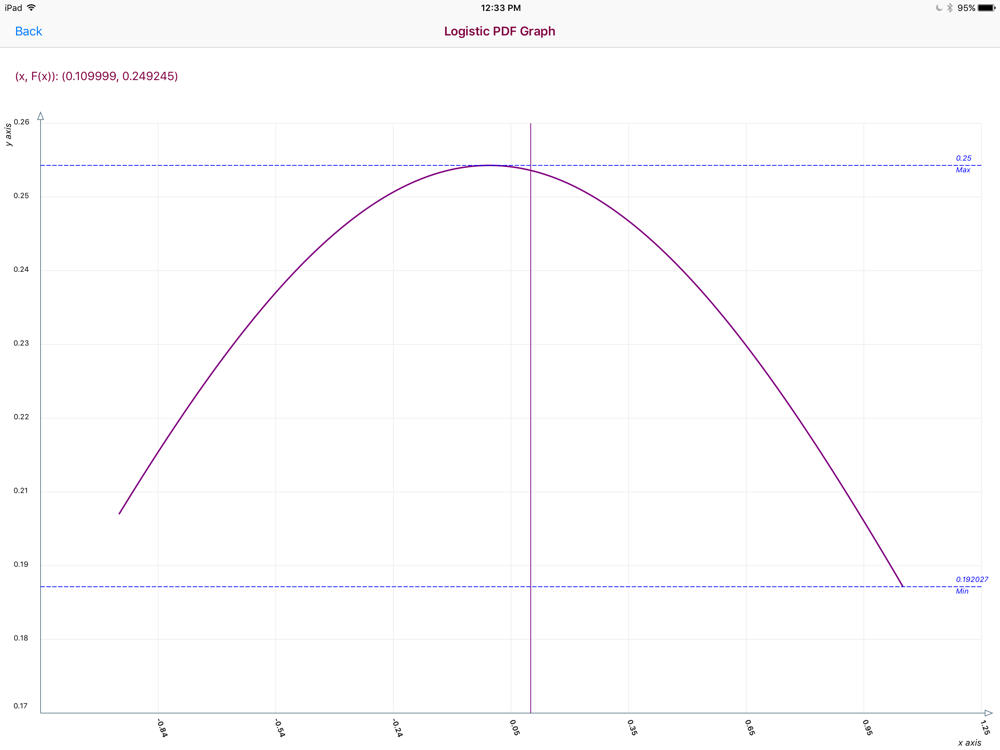
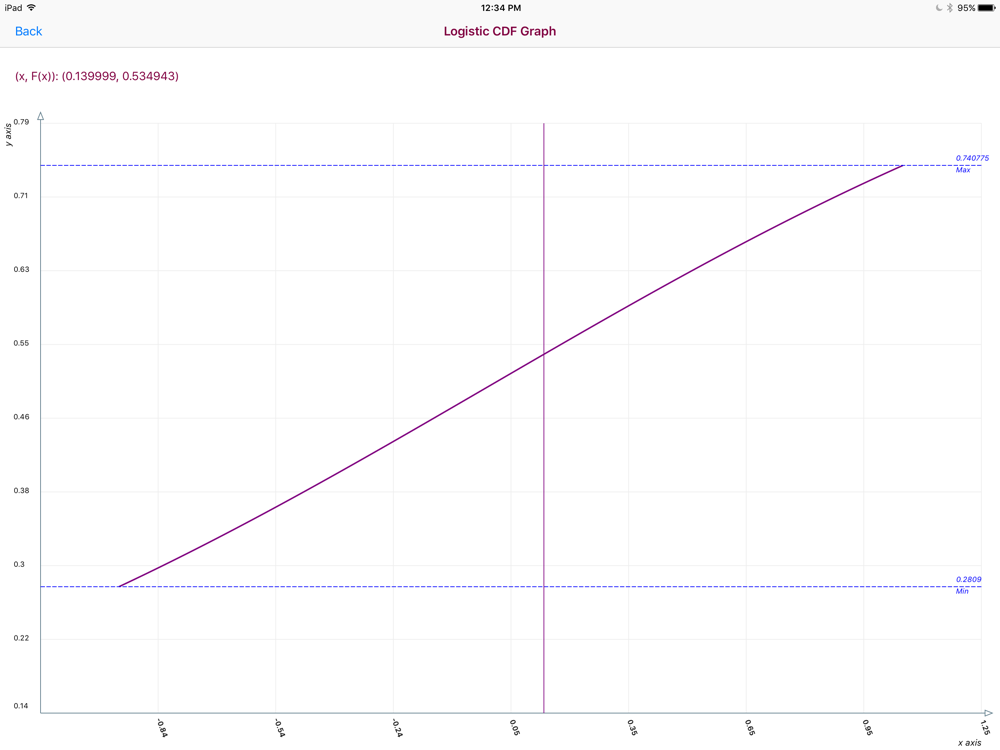
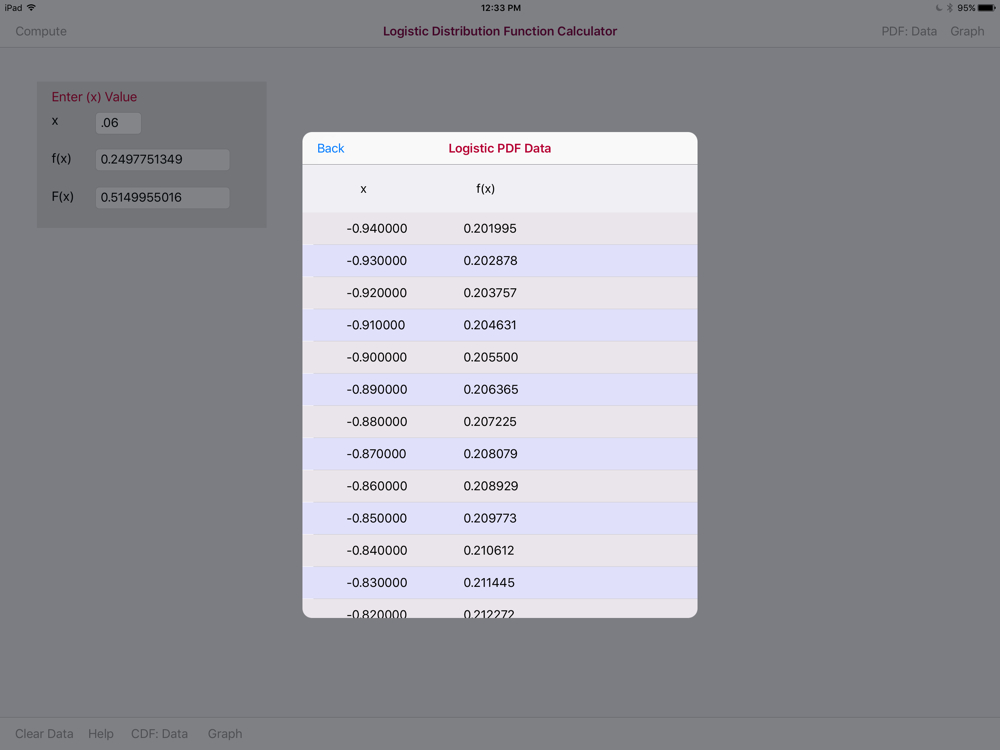
The Logistic Disribution Calculator accepts a random variable x and returns the probability that the random variable with a standard Logistic Distribution has a value less than variable x. The Logistic Distribution F(x) graph displays the Logistic Distribution as a bell-shaped curve for a given value of the random variable x.
The Data Tables and Graphs increment the x value 200 times with a 0.01 increment value with -1.0
 en
en
 English
 Español
 Русский
 Deutsch
 Français
 العربية
 Italiano
 Türkçe
 Polski
 Português
 Indonesia
 日本語
日本語