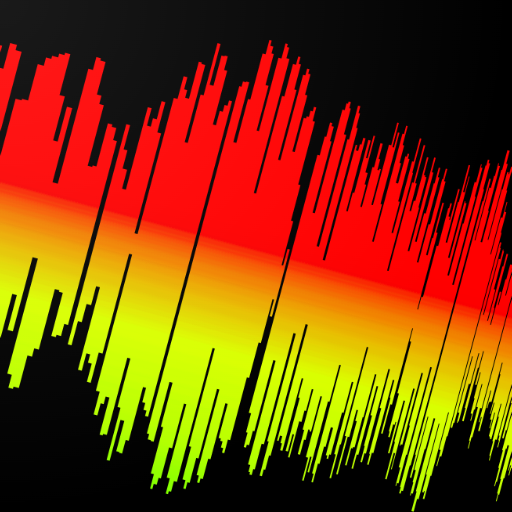
Spectre FFT creates beautiful spectrograms showing the frequency content of your audio data. It can use your device microphone to monitor your voice or surroundings, or internal audio from your background audio apps.
An oscilloscope and spectrum analyzer are included to visualize the data.
- Audio sample rate from 8000 to 44100 Hz
- FFT size from 128 to 2048
- Optional sliding window: 2 to 8 times overlap
- Selectable gradients with linear luminance
- Spectrogram timespan from 0.5 to 30 seconds
- Black level from -80 to -120 dB
- Tap the screen to pause and restart the displays
Note: internal audio sample rate and quality are limited by Android platform.
A Fast Fourier Transform (FFT) is used to calculate the spectrum of the audio data, breaking the data into multiple frequency bands from 0 Hz to half the sample rate. A higher sample rate will show a larger frequency range, whereas a lower rate will show a smaller range with more detail. The 8000 Hz rate is excellent for viewing voice and low frequency sounds.
The number of frequency bands displayed is half the FFT size. Increasing the size will generate more frequency detail, but reduce time resolution. Smaller FFTs will allow you to see shorter sounds and frequency changes. Keep in mind that your screen resolution will limit how much detail can be shown.
The oscilloscope and spectrum analyzer can be enabled and disabled under the app settings. The scope shows the audio waveform, using triggering (with FFT size over 1024) to produce standing waves. The spectrum analyzer shows the frequency data - low to high frequency from left to right.
Spectrogram data is drawn vertically - low to high frequency from bottom to top. Color gradients are used to represent the intensity of each frequency band. The spectrogram is drawn from left to right as time passes, wrapping to the start when it reaches the edge of the screen. The time span can be selected in the app settings.
Frequency data can be displayed with a linear or logarithmic scale. The linear scale shows more detail and aids harmonic analysis, whereas the logarithmic scale better represents how we hear.
It is highly recommended to keep the FFT Window feature enabled, as this prevents frequency artifacts due to sampling the audio data in blocks.
The frame overlap setting increases the time resolution by calculating multiple FFTs as the audio data is received. This is especially useful when using low sample rates or large FFTs, where there are significant delays before the audio data is available. An "Auto" setting adjusts the overlap to maintain an FFT rate of around 50 per second.
A warning is shown if the application cannot keep up with the incoming audio data. This may happen if you are using large FFTs and/or large frame overlaps. Reducing either of these settings should fix the issue.
The display black level setting is used to control how much detail is shown for quiet sounds. A lower value will cause more noise to be visible, but allows very faint signals to be detected.
 en
en
 English
 Español
 Русский
 Deutsch
 Français
 العربية
 Italiano
 Türkçe
 Polski
 Português
 Indonesia
 日本語
日本語