No#1 Fibonacci calculator in play store
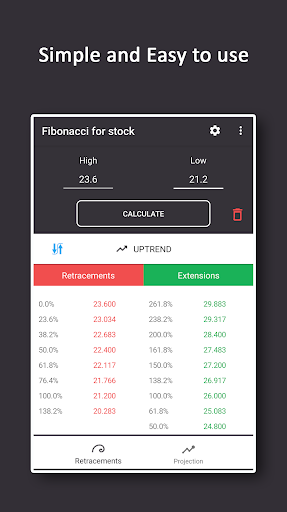
Now you can calculate Fibonacci Retracements and Projections in few clicks
A Fibonacci retracement is a popular tool among technical traders and is based on the key numbers identified by mathematician Leonardo Fibonacci in the 13th century.
In technical analysis, a Fibonacci retracement is created by taking two extreme points (usually a major peak and trough) on a stock chart and dividing the vertical distance by the key Fibonacci ratios of 23.6%, 38.2%, 50%, 61.8% and 100%. Once these levels are identified, horizontal lines are drawn and used to identify possible support and resistance levels.
Fibonacci Retracements are usually used to get a target, which is likely to be achieved in near future. It not only helps you to decode the likely target but also plays an important role in indicating the likely RESISTANCE and SUPPORT level for a stock.
61.8%, known as Golden ratio is to be looked out for.
Fibonacci Retracements, when used in combinations with any pattern or Trend line break-out, will help you to great extent in determining 3 Things - Target, Support, and Resistance.
Fibonacci price projections is another support and resistance indicator that uses Fibonacci ratios to analyze price movements and identify potential support and resistance levels. It however differs from Fibonacci price retracements and price extensions in that it performs a proportional study of the current price swing in relation to a previous swing in the same direction.
Some charting applications have this tool labeled as Fibonacci Expansions.
How is it used?
The application of Fibonacci projections differs from other studies in that two price waves are required: an initial wave and a completed wave in the counter direction. The Fibonacci price projection is then projected from the end of the counter trend move.
When using Fibonacci projections, the technical analyst waits for the market to turn and then applies the Fibonacci projection ratios on the price wave that preceded the last movement. This study is then projected from the end of the last price swing. This requires three points: a previous swing high and swing low followed by another swing high in a down trend, or a previous swing low and swing high followed by another swing low in an uptrend. The Fibonacci ratios are applied to the swing high to swing low in a down trend and projected from the next swing high, or from the swing low to swing high in an uptrend and projected from the next swing low. Horizontal lines are then drawn at these levels and are used a possible support or resistance levels.
 en
en
 English
 Español
 Русский
 Deutsch
 Français
 العربية
 Italiano
 Türkçe
 Polski
 Português
 Indonesia
 日本語
日本語