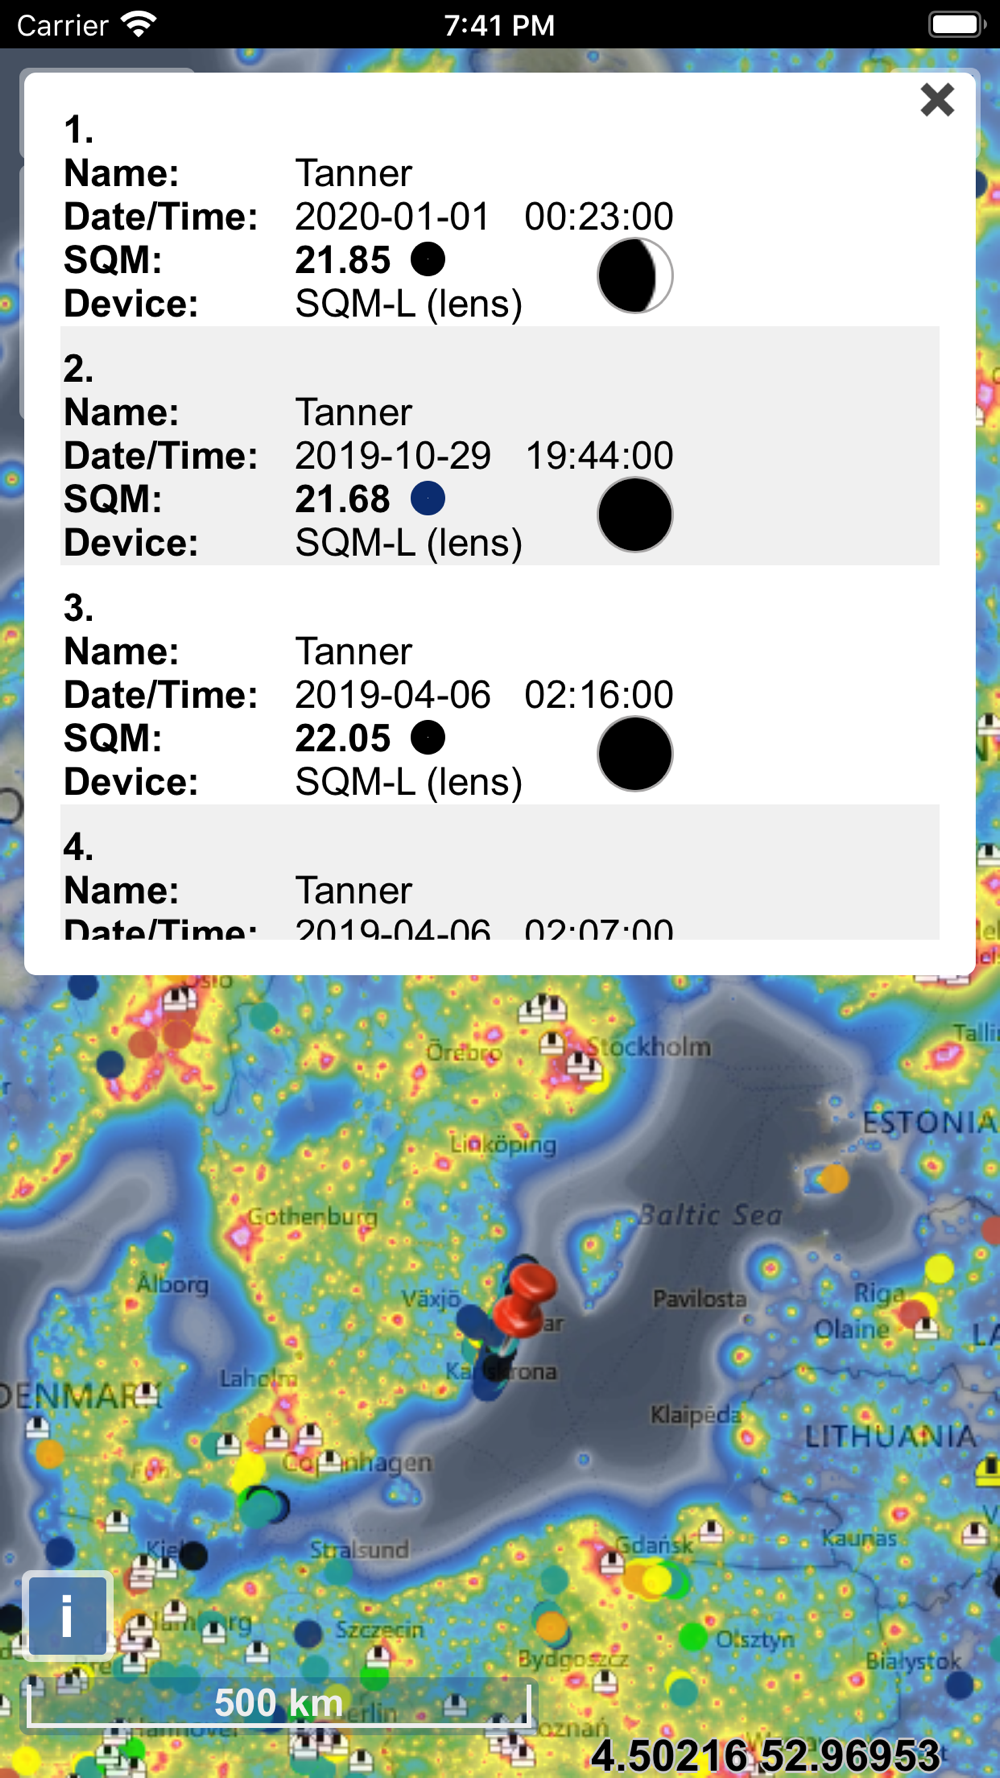
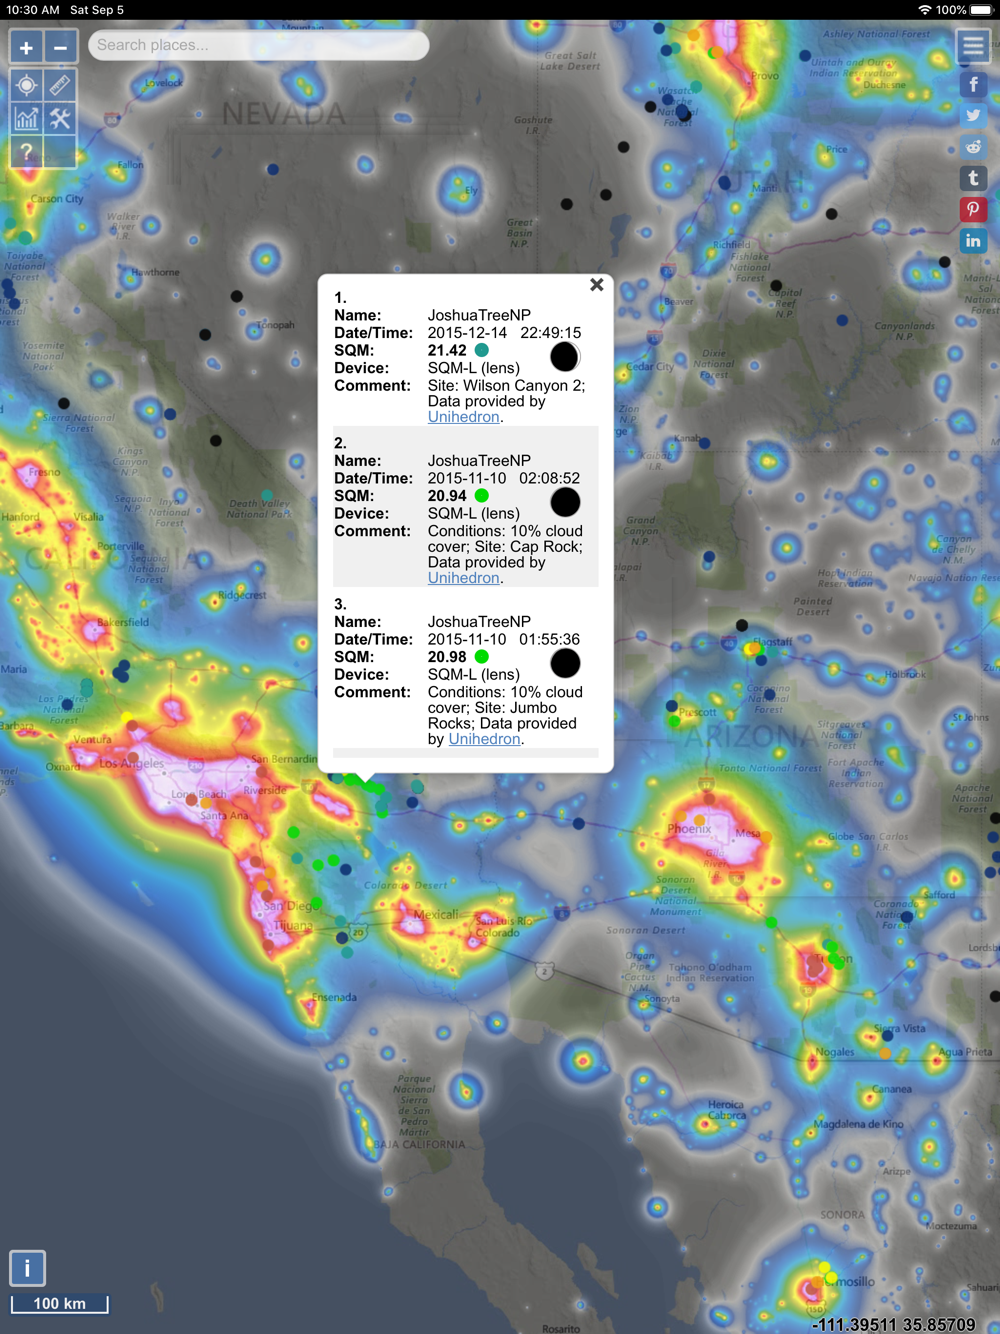
The map displays VIIRS/DMSP/World Atlas/Clouds/IAU observatories and the user SQM measurements overlay over Microsoft Bing base layers (road and hybrid Bing maps).
The primary use is to show VIIRS/DMSP data in a friendly manner, but over time it also included some other interesting overlays that concern light pollution like SQM/SQC, World Atlas 2015 zenith brightness, clouds and IAU observatories. If you have a permanent SQM reader installed you can add it to the map by sending me an e-mail.
Annual VIIRS comparisons are to be avoided as there are too many factors involved by just doing a direct comparison. If you want an analysis of radiance (VIIRS/DMSP) changes over a period of time, then please use the Lighttrends application (look under Help).
Functionalities:
- VIIRS, Sky Brightness and Cloud layers
- Road & Terrain base maps
- Cloud animation for the last 12 hours
- Get detail radiance and SQM values from layers at a click. For World Atlas 2015, you also get Bortle class estimation.
- SQM, SQM-L, SQC, SQM-LE, SQM readings submitted by users
- Submit your own SQM (L) reading
- Observatories layer
- Save your favorite locations
- Distance measurement tool with azimuth angle report
- Offline mode (Sky brightness map and a base map are saved to your device, so it will be displayed enem od you are offline)
 en
en
 Español
 Русский
 Deutsch
 Français
 العربية
 Italiano
 Türkçe
 Polski
 Português
 Indonesia
 日本語
日本語